Starting Out · Lesson 5
Diversification
Why owning the whole basket beats picking the winners.
7 min read
Most people imagine that picking the right stocks is the goal of investing — find the next Apple, the next Amazon, the next Shopify. The data on what individual stocks actually return says something different. The middle stock — the one right at the halfway mark of every stock that ever traded — has returned less over its lifetime than a basic savings account.
That's the diversification puzzle. Most stocks don't make money over the long run. The market's long-term gains come from a small handful of extreme winners. Owning the whole stock market means owning all of them. Picking a few means probably missing them.
What the long-run data shows
A 2018 study of about 26,000 US stocks from 1926 to 2016 found two surprising things:
- The middle stock earned less than a basic interest-bearing savings account over its lifetime. More than half of all individual stocks lost to the safest possible alternative.
- About 4 stocks out of every 100 generated all the market's long-term wealth. The other 96 collectively returned almost nothing extra above the safest alternative.
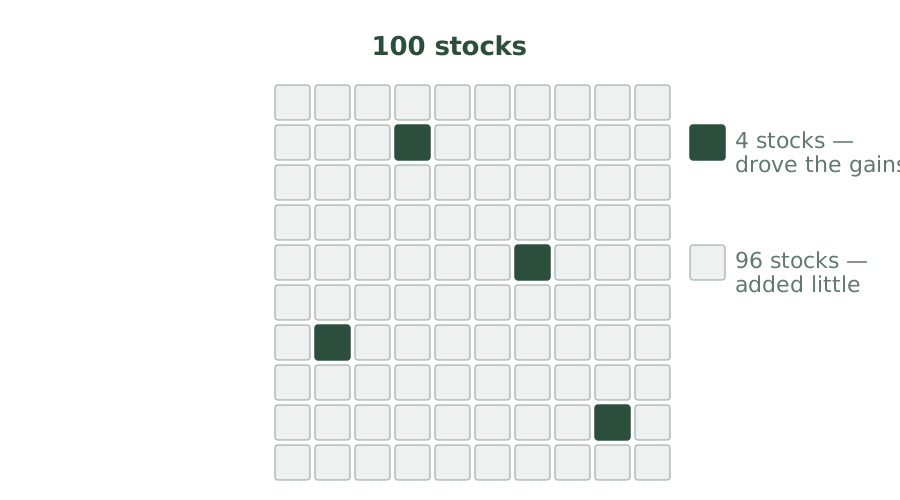
The pattern isn't unique to the US. The same researchers studied other countries' stock markets and found similar shapes — most stocks lose to short-term safe assets; a tiny fraction drives the gains.
The histogram above shows the distribution of lifetime returns across all those stocks. The tall bars on the left and middle hold the stocks that lost to safe assets or barely matched them. The very small bars on the right hold the few that drove all the gains. That right edge is where the long-term market average comes from.
Why picking stocks is harder than it looks
To beat the broad market by picking individual stocks, the investor has to consistently identify the small group (about 4 of every 100) that drives the gains — in advance, before the gains show up. The chance of picking any one of those by random is about 1 in 25. The chance of picking a stock that even beats a savings account is below 1 in 2.
Even professional fund managers — full-time researchers paid to do exactly this — usually fail at it. Long-term studies show that roughly 80% of professionally managed US stock funds underperform the broad market over 15-year stretches. The professional edge isn't enough.
The way to capture those few winners isn't to find them. It's to own all of them by default.
The investor's edge isn't picking the winners. It's owning all of them.
Two ways to invest the same $10,000
Riley spends evenings researching individual companies and picks 10 stocks to invest $10,000 across. Riley reads quarterly reports, follows industry news, listens to founder interviews. Five years in, three of the picks are up, four are flat, three are down. The portfolio has roughly matched a savings account.
Casey buys one broad-market diversified fund that holds the whole US stock market — about 3,000 companies in a single product. Casey doesn't research individual stocks at all. Five years in, the portfolio is up about the same percentage as the broad market — including whatever the right-tail winners did during those years.
The difference isn't about who worked harder. Riley's 10 picks were each researched; Casey's 3,000 holdings were not. The math of the right-tail concentration is what makes the difference.
Further reading
- Do stocks outperform Treasury bills? — Hendrik Bessembinder (Journal of Financial Economics, 2018). The original paper documenting the right-tail concentration finding. The technical write-up of what this lesson covers in plain language.
- A Random Walk Down Wall Street — Burton Malkiel. Classic case for broad diversification over stock-picking. Covers the active-vs-passive evidence in depth across many editions.