Starting Out · Lesson 2
How compound interest works
How small monthly amounts turn into big ones over decades.
8 min read
Saving feels like a straight line. Put $200 aside each month, and after a year there's $2,400. After ten years, $24,000. Twenty years, $48,000. Add them up — the line keeps going straight.
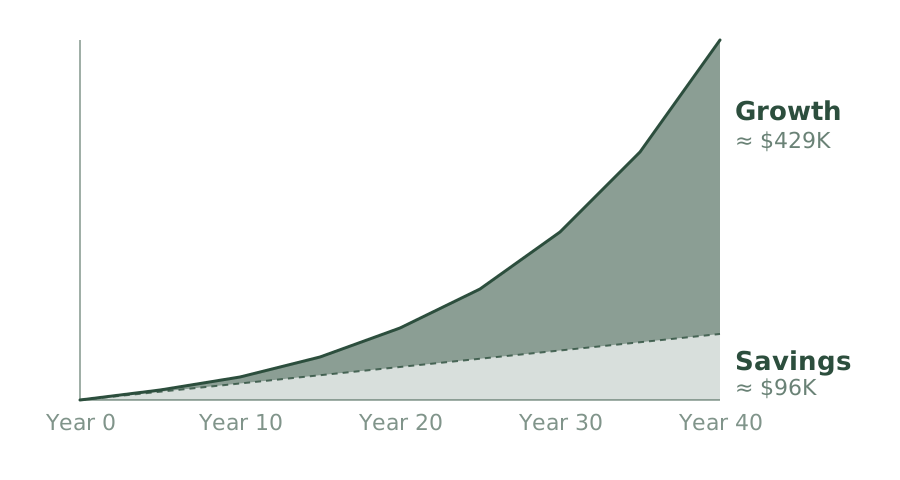
Money invested doesn't move in a straight line. Each year's gains earn their own gains the next year. The line bends upward — gently at first, then steeper. Over decades, most of what's there at the end didn't come from the monthly amounts saved. It came from gains earning gains.
The shape of the curve
Take someone who invests $200 a month for 30 years, earning about 7% a year on average. Adding it up the simple way: 30 years × 12 months × $200 = $72,000 of monthly savings.
But the portfolio at year 30 isn't $72,000. It's closer to $245,000.
About $72,000 came from those monthly savings. About $173,000 came from gains earning gains on top of earlier gains. The savings are the seed. Most of the final amount is what those savings grew into.
Stretching the same plan to 40 years doesn't double the result — it more than doubles it. Forty years at the same rate lands closer to $525,000, with only $96,000 of that coming from monthly savings.
Why the bend gets steep
In year one, the gains land on $1,200 of saved money — a few dollars on top. In year fifteen, the gains land on a much bigger pile, and that one year's gains are bigger than the whole year's $2,400 of new savings. From around year fifteen on, gains add more to the portfolio each year than the monthly savings do.
That's what means in practice. The curve bends because what the gains land on grows every year.
Saving makes a line. Compounding makes a curve.
Why starting early beats catching up
Riley starts at 25 and saves $200 a month for 40 years. Casey starts at 35 and saves $400 a month for 30 years — twice the monthly amount, working hard to catch up. At about 7% a year, Riley ends up with more than Casey. The earlier money rides the curve for longer, and the extra ten years of bending matter more than the extra $200 a month.
Consistency matters too. A ten-year gap in the middle — a career change, parental leave, an illness — doesn't reset what's already there. But the years missed don't earn anything either. The bend only works while there's something invested to bend.
Use the calculator below to try the math. Pick a monthly amount, a rate, a number of years. Watch how the split between savings and gains shifts as the years grow.
Further reading
- The Psychology of Money — Morgan Housel. Chapter 4 makes the same point: time matters more than the monthly amount or the rate of return.
- A Random Walk Down Wall Street — Burton Malkiel. Chapter 12 walks through long-run compound returns and why early starts pay off so much more than late ones.